Welcome to our 2024 third quarter Global Blue Chip Insights commentary.
In this update we will cover the following:
- Performance commentary for Q3
- What are options and how do they influence markets?
- Stock in focus – Bruker Corporation
Global Blue Chip Q3 2024 performance commentary
Equity markets have been exceptionally strong throughout 2024. While the Blue Chip performance may not have matched the broader market performance, there are good reasons for this divergence, which we will explore in this note.

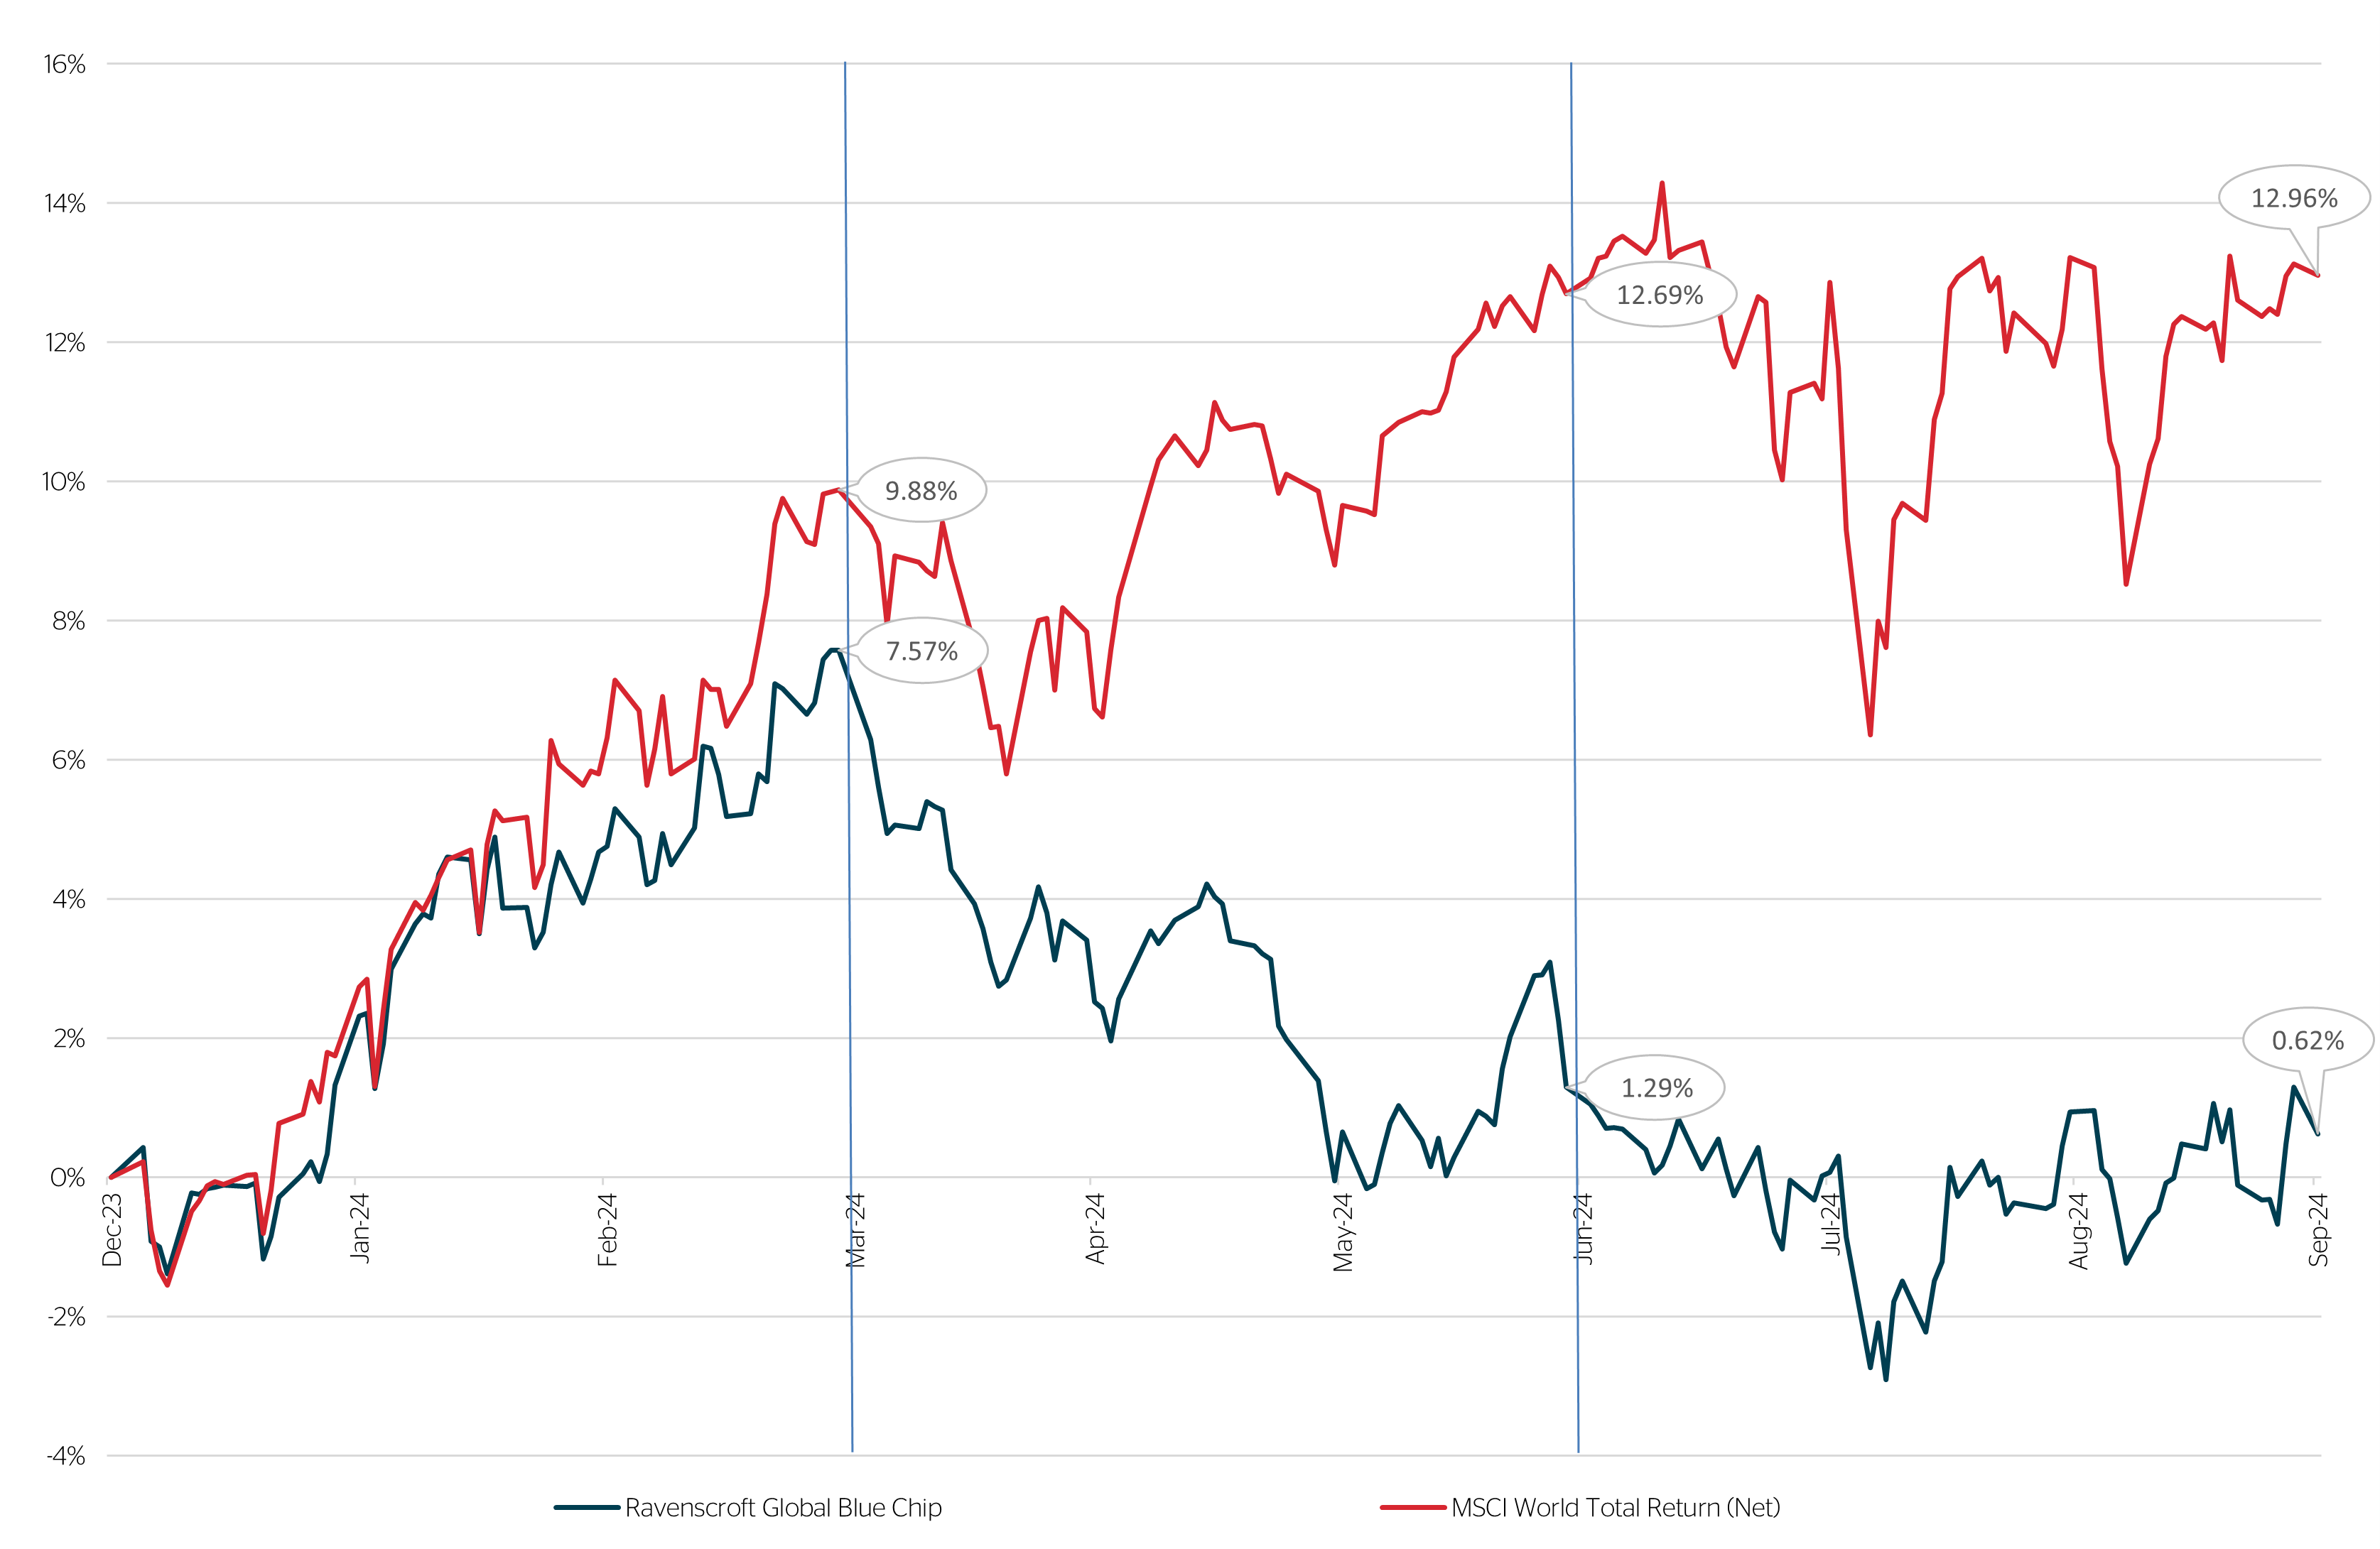
Chart 1 shows the year-to-date performance of the strategy against the MSCI World TR (Net) in GBP (quarters are marked out using vertical blue lines). In Q1 we saw good performance, although we marginally underperformed a very strong bull market, which was no surprise given our defensive composition. The strategy also protected on the downside during a very volatile market in Q3. Again, given the construction of the portfolio this was expected. The outlier was clearly Q2 and what materialised throughout a volatile Q3 shed more light on what was really going on during that quarter.
Contributors and detractors were covered in our Q2 quarterly commentary and our Insights newsletter so we will not repeat them here. However, the volatility spasm that hit markets in early August revealed how vulnerable markets have become to systemic risks.

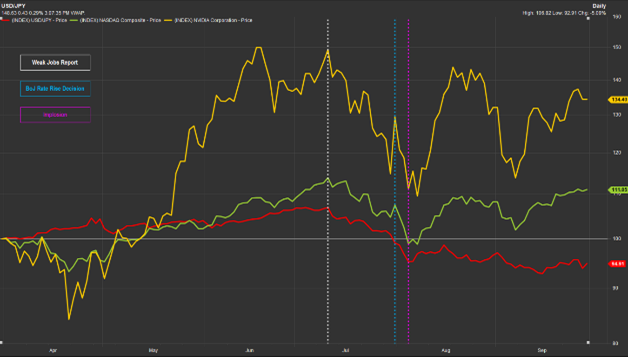
As option trades are closed any hedging associated with those trades is also shut down. Simply put, buying begets buying and selling begets selling as market makers hedge their exposures. Falling asset prices continued to pressure carry trade profits and the unwinding continued throughout much of July before the Bank of Japan (“BoJ”) announced its higher-than-expected rate rise.
The spasm that followed the BoJ’s announcement could only be explained by margin calls on traders that simply couldn’t get out of the way. However, with the volatility relatively well contained with little evidence of damage done to the broader financial ecosystem or indeed the economy, the spasm didn’t last long and prices were free to recover.
The worrying outcome is that these distortions become a feature rather than one-off bugs in the system. Is the market being driven more by heavily correlated trades or by the fundamentals of the underlying companies? We’re beginning to suspect the former.

We commented in a previous Insights piece about Time Arbitrage and how the market’s time frame has shrunk so that average holding periods are now estimated to be below one year. This type of behaviour is momentum and flow orientated, which on the one side offers fantastic longer-term investment opportunities but can be a huge source of frustration when the market shows its ambivalence.
Heightened short-termism
As a result of the increasing short termism, we have been witnessing an increasing level of volatility at the individual stock level - especially around sensitive times such as earnings announcements. The rise of algorithmic trading and pod shops is creating an environment that increases stock volatility. Pod shops deploy trading strategies that seek to achieve very short-term trading objectives. Failure to meet them results in your immediate replacement. The incentives to stay in the game are huge, which reminds us of Charlie Munger’s famous quote “show me the incentive and I’ll tell you the outcome”. The popularity of pods has never been greater, resulting in huge amounts of money (often borrowed to increase return) being deployed in similar ways and strategies, often crowding them out and arbitraging the very anomaly they seek to take advantage of, which drives the leveraging of the trade to generate the expected return etc. What could go wrong? Because of the risks involved risk management is a key attribute within pod trading and as a consequence they are very quick at reducing positions that go against them and taking profit when targets are reached. All very well and good until you’re trapped. Obviously, a detrimental experience for the pod and their employees, the hedge fund that invested in them, and now the broader market as their impact is amplified due to the leverage deployed.
Downward momentum no longer attracts value buyers but the attention of other (often algorithmically driven) short sellers add to the selling pressure. This often results in severe declines in stock prices that go beyond any fundamental justification. Such is the demand for immediate business momentum that the moment this stalls the stock becomes toxic and is treated as such. But even this natural reduction in time frame due to uncertainty in the world we live in has become extreme. As a result, a company can hit or beat actual expectations but if forecasts come up light the market now takes this as a sign of weakness and dooms the shares almost instantly. In this environment it is almost impossible for management to make long-term capital allocation calls that take away from the short-term business momentum without some sort of adverse reaction. Those that are brave enough to do so see their shares being given the sell treatment.
The table below shows some of the fallout that followed a ‘not so acceptable’ earnings announcement amongst some of our holdings during the quarter. Please note these are one day movements that followed the release.
Slowing consumer
The strategy’s consumer positions were also impacted by negative investor sentiment as the mixed data questioned the strength of the US consumer. Inventory issues have plagued a number of businesses as management teams have struggled to gauge post-Covid consumption trends. Whether the consumer pattern is a recessionary indicator or whether it is a post-Covid normalisation of spending habits remains to be seen.
| Nike Inc. | -20.4% |
| Estée Lauder | -13.4% |
| Etsy Inc. | -16% |
| Bruker Corp. | -11.4% |
| Edwards Lifesciences | -31.5% |
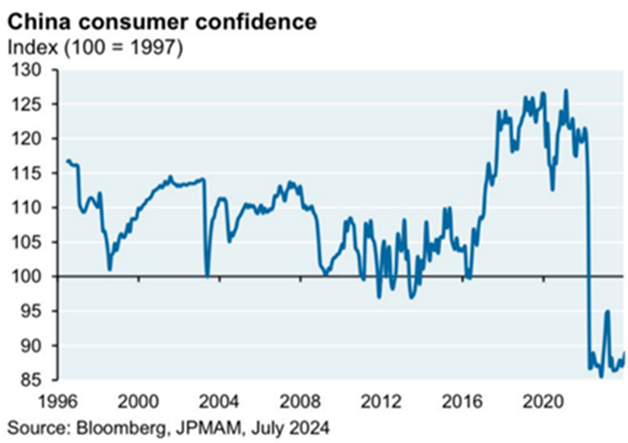
Posing additional problems to our global consumer theme is the continued decline in China’s economy and the impact this is having on the Chinese consumer.

A number of the strategy’s holdings have built a significant presence in China over the years, benefitting from the country’s economic growth, expansion of its aspirational, middle class consumer, whose willingness to
consume has been fuelled by the wealth effect of rising property prices. With these drivers clearly in reverse, the Chinese consumer is saving more, resulting in reduced sales and profits from those subsidiaries. Investors remain jittery as investors question the effectiveness of China’s stimulus announcements to date. The initial euphoric market surge has since faded, and we await further announcements from the Chinese Communist Party
The third quarter
Performance fell within expectations in the third quarter when the Yen carry trade imploded, resulting in significant market volatility. The strategy weathered this very well due to our underweight to the Magnificent Seven (“MAG-7”) and our exposure to more defensive sectors such as large pharma and consumer staples. The stimulus measures announced by the Chinese Communist Party also helped alleviate some of the pressure felt by holdings with significant Chinese exposure. The market effect of those measures was short lived, but we expect more to come in the coming weeks and months.
What’s next?
There is anecdotal evidence to suggest that a number of our holdings used their Q2 earnings to ‘sandbag’ guidance. It is early days so we won’t get too carried away but if this continues and spreads across to a number of our consumer positions then 2025’s year-on-year comparisons should look very attractive and should re-ignite market interest in their shares.
From a valuation perspective the portfolio looks incredibly attractive. The portfolio is expected to produce double-digit earnings growth over the coming years, which is higher than the overall market aggregate, yet the
strategy trades on a multiple that is lower than that of the broader market. A rare combination indeed!
Five-year performance
| 30/09/2023 - 30/09/2024 |
30/09/2022 - 30/09/2023 |
30/09/2021 - 30/09/2022 |
30/09/2020 - 30/09/2021 |
30/09/2019 - 30/09/2020 |
Annualised Since Inception 31/12/11 |
|
| Global Blue Chip Portfolio | 5.3% | 12.0% | -4.5% | 16.9% | 4.8% | 10.4% |
Source: Ravenscroft, compiled 10/10/2024
It is important to note that past performance is not a reliable indicator of future results.
What are options and how do they influence markets?
Options are a derivative instrument that offers the owner the right (but not the obligation) to buy or sell the underlying asset at a specified price prior to expiration. Buyers of options have limited downside risk – the premium paid – but gain exposure to larger notional values than they could otherwise afford. This leverage exacerbates returns that would not otherwise be achievable by simply holding the underlying asset.
Glossary of terms
| Derivative | A contract whose value is based on the performance of an underlying asset, like stocks or commodities. |
| Delta | Measures the rate of change in an option’s price relative to a $1 change in the price of the underlying asset. For instance, a delta of 0.50 indicates that the option’s price will increase by $0.50 for every $1 increase in the underlying asset’s price |
| Dispersion trade | A strategy where traders profit from differences in volatility between index options (less volatile) and individual stock options (more volatile). |
| Downside risk | The potential for an investment to decrease in value or underperform. |
| Gamma | Measures how the rate of change of an option’s price will change with fluctuations in the underlying price. The higher the gamma, the more volatile the price of the option is. |
| Hedging | The practice of reducing risk by taking an offsetting position in a related asset, often used by market makers to balance their exposure. |
| Premium | The cost of buying an option, which represents the maximum loss for the buyer. |
| Vega | A measure of how much the price of an option is expected to change with a 1% change in implied volatility. |
However, options are not simply a derivative bet on an individual stock’s price movement. They also take into account the expected volatility of that asset through the life of the option. The implied volatility embedded within an option can have a significant influence on the pricing of the option through its life. Vega, shows how much an option’s price is expected to change with a 1% change in implied volatility. This can significantly affect whether the option is considered expensive or cheap. Options with high Vega, meaning they have higher implied volatility built into their price, may not perform as expected even if the underlying asset moves in the predicted direction. This is because the decline in implied volatility can reduce the option’s price, outweighing the positive effect from the asset’s price movement (measured by delta).
More sophisticated traders will seek to take advantage of these traits. Dispersion traders, for example, seek to arbitrage the difference in option volatility pricing between index options (which usually have lower implied
volatility) and underlying stocks (which tend to have higher implied volatility due to the more volatile nature of individual stock movements compared to the broader index). So long as stock and index correlations remain low (i.e. their prices bob up and down independently) it can be a highly effective and profitable strategy.
Option volumes can have a real-world impact on the underlying assets due to the hedging that goes on by the market makers (“MMs”) who provide liquidity to the option market. Most MMs prefer not to take a directional stance in their positions, so they hedge their overall exposure neutralising their aggregate delta or gamma position. Hedging takes the form of buying or selling the underlying asset in sufficient volume to ensure equilibrium within their books. As prices are constantly moving, hedging exposures is an ongoing task that is best handled by machines. In other words, if the need to hedge an exposure becomes so great it
could add meaningfully to the buying or selling pressure already being experienced by the underlying asset.
When option positions are closed any hedging associated with that position is also closed (in order to keep the books in equilibrium). The closing of option trades down and the subsequent need to hedge less may have added to the downward pressure on stocks during this period.
We suspect the shutting down of the dispersion trade due to stock correlations rising helped set the stage for the volatility spasm that followed the Bank of Japan’s higher-than-expected rate raise on 30th July. Any trader or hedge fund that was already under pressure by the time the Bank of Japan surprised markets was almost certainly margin called and carried out. The volatility only lasted a handful of days, culminating on Monday 5th August as the Nikkei futures slumped by as much as 12% during the Asia session, forcing the NASDAQ futures as low as 6%. This would mark the final flush that settled all outstanding scores.
We do not deploy options within our investment strategies. However the beauty of options is that they can be used to structure-specific risk profiles i.e. known win/loss profiles and their likelihood of success. They can also be used as a leveraged way to express a view. Either way the use of options has exploded since the pandemic with daily traded volumes averaging 47 million contracts a day compared with 19 million per day in 2019 – according to the Financial Times. Given their popularity it is hard to see this trending use of options reversing and we should expect option positioning to play an increasingly important role in market dynamics going forward.
Stock in focus: Bruker Corporation
We first introduced shares in Bruker Corporation to the Global Blue Chip fund around 14 months ago. During this time the shares have experienced something of a “round trip”, despite consistently demonstrating very strong underlying performance. Bruker’s prospects for accelerated earnings growth in the years ahead are both real and exciting, but not reflected in the valuation – and this is why we own the shares.
Based in the US but with German heritage, Bruker produces high-end scientific instruments sold into a diverse range of end-markets including academic and government laboratories, industrial and green technologies, biopharma, microbiology, semiconductors and food. The common thread running through Bruker’s product offering is the ability to explore life and materials at the highest possible resolution, whether microscopic, molecular or cellular.

identifying molecular structures. To this day, Bruker remains at least five-years ahead of anyone else in the field of NMR. Even with a price tag of around $18m, Bruker’s top of the range NMR machines are in demand at leading research institutions worldwide.
In charge since the 1990s, Frank owns almost 30% of Bruker’s shares. Most interesting to us is that, in our opinion, he’s at least as impressive as Günther was, if not more so. At Global Blue Chip, there are three qualities we ideally like to see in a CEO:
- Deep understanding of the company’s products – e.g. an engineer if it’s a technology business, a scientist if it’s a science-based business, a physician if it’s a medical business, a marketer if it’s a brands business etc.
- Operational excellence in running a business day-to-day (i.e. a “good business person”).
- Savvy in capital allocation – a track record in deploying capital wisely, whether it’s reinvesting in the company, returning capital to shareholders or acquiring other businesses.
Normally, we are content with two out of three, so long as we’re sufficiently convinced that the CEO has the right talent within their leadership team to make up for any areas where they might be lacking themselves (as an aside, we can add an indispensable fourth category – “great judgment in hiring”). Very rarely is there a CEO who scores top marks in all three, but Frank Laukien, in our opinion, is one.
As an accomplished scientist and inventor himself, Frank’s expertise straddles the worlds of engineering, physics, chemistry and biology, all of which are critical to Bruker’s products and customers. On the operational
side, Frank and his team have spent the last 10 years positioning the company competitively in areas of high structural growth – for example spatial biology, proteomics, semiconductor metrology and cleantech, among others. On the capital allocation side, Frank has made a large number of modest-sized acquisitions over the years, but he has done so at sufficiently low prices such that the returns have been excellent. His ability to do so is complemented by his technical understanding (earlier stage technologies that might be less obvious to peers) and operational excellence (getting acquisitions well-integrated). The result is a business that consistently outgrows its peers, has a great runway for margin expansion and all the while produces high returns on capital.
We believe that management’s ambitions for above-market organic revenue growth as well as steady operating margin expansion are very credible – given their proven track record and years of experience doing
just this. If they can continue to manage this, then Bruker can grow its earnings per share in the teens percentage range for at least the rest of the decade. In our view, a structural growth profile of this nature should be valued at a significant premium to where the shares are today. Despite continued strong underlying performance, 2024 has seen a temporary “pause” in earnings per share growth for the company while Bruker digests a recent strategic acquisition. However, as we move into 2025 we expect a very significant re-acceleration and this could prove to be a catalyst for the shares.


